How Often Should I Blog?
 Does it matter how often you blog? Does more frequent posts equal more traffic?
Recently I’ve been reading a lot of opinions on how frequently you should be posting.
I’ve seen many bloggers suggest that the more often you post, the more traffic (and leads and business) you can generate.
Looking at successful blogs like Social Media Examiner with daily, long-form posts (and a cadre of guest bloggers) and Michael Hyatt’s Intentional Leadership blog with 4 to 5 posts a week, that seems to work out, at least for them.
On the other hand, I look at the extremely successful Social Triggers blog from Agents of Change presenter Derek Halpern. He only posts a couple of times a month! (Slacker. 😉 )
For a long time I’ve suggested that while there’s no magic number, blogging 2 – 3 times a week (about 10 posts a month), was a good target to shoot for…at least during the first six months of your blog to build up a critical mass of posts.
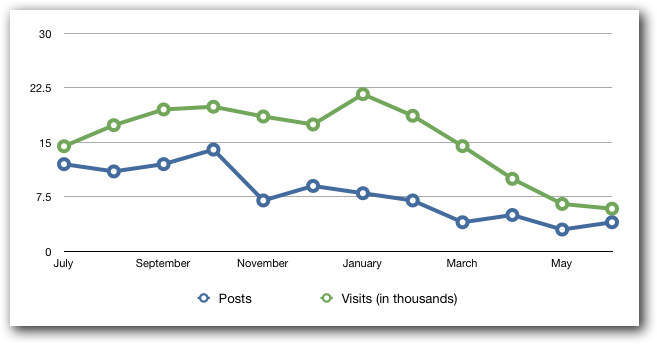
However, after reading these differing opinions I decided to look at the posts vs. traffic reports at flyte’s web marketing blog. Here’s what I found:
At least for our own business blog, a drop in posts coincided with a drop in traffic.
Correlation Isn’t Causation
Now, a lot of other factors could be in play here, including:
- More competition from other web marketing blogs
- Less interest in web marketing topics in general
- Prospects’ desire to get their marketing information through other channels (video, podcasts, etc.)
- Less marketing of the posts we did put up
- Lower quality posts (heaven forbid!)
I’m also not looking at how many page views occurred during that time, or the amount of time spent on the site per visit, or whether the traffic that did show up moved over to our website and/or contact form…the desired outcome for our business.
However, my takeaway is that we need to step up our game. While I’m still happy with the traffic and leads we’re generating from our blog, I can see that when we took our foot off the gas, we definitely experienced a slowdown.
How I Made That Chart
Since I’m not a numbers person, I wanted to see a visual representation of my results.
I went into my Google Analytics and exported a year’s worth of traffic in the “month” view. I then pulled it into Apple’s Numbers program. You can do it in Excel, but your charts won’t be as pretty. 😛
I then just added a 3rd column (after “Month” and “Views”) called “Posts.” I literally just typed in the number of posts I did per month which I could easily find in my archives…it took me all of two minutes.
Finally, I tweaked views by dividing by 1,000. I.e., 14,427 views became 14.427 so that it would match up better against the number of posts and then just added “(in thousands)” for clarity.
From there, Numbers gave me a myriad of visually appealing charts to choose from.
Do You Agree?
Have you found similar results in your own traffic reports? Or do you think there are flaws in my thinking?
Let us know in the comments below!


